
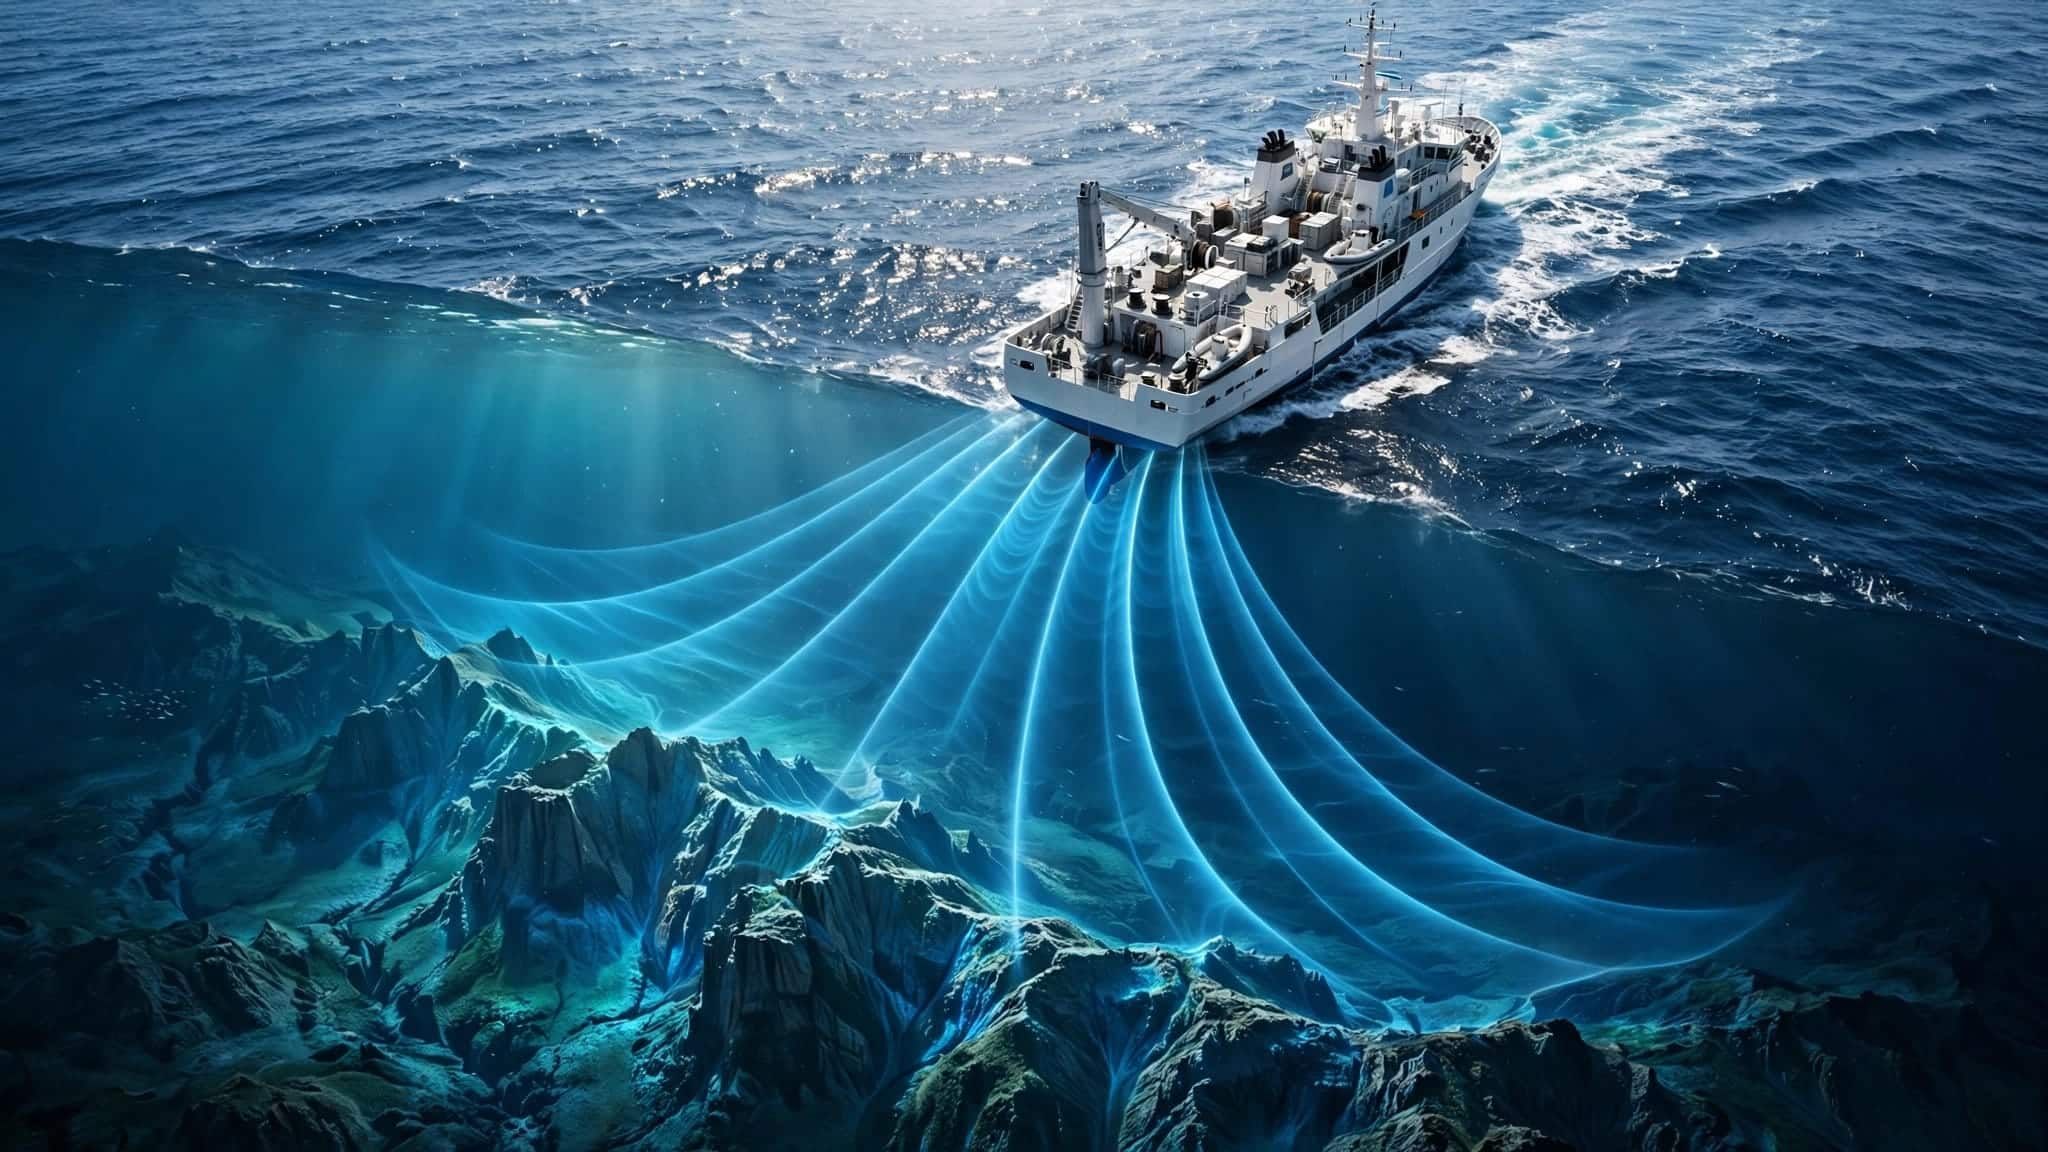
We can map an underwater mountain without ever photographing it, because sound travels through seawater far better than light. Ocean floor mapping mostly uses returning echoes to measure ocean depth, while satellites reveal broader features through changes in sea surface height.
The surprising part is how much work happens between hearing an echo and drawing a trustworthy map. To understand that process, it helps to start with what those measurements tell us.
This post may contain affiliate links. If you make a purchase through these links, I may earn a small commission at no extra cost to you.
Why ocean floor mapping starts with sound
Bathymetry is the study and measurement of underwater depths and the physical shapes of ocean, lake, and river floors. Think of a topographic map, with its hills and valleys, except the terrain happens to be underwater.
Turning an echo into a depth
An echo sounder sends a sound pulse toward the seabed and measures how long its echo takes to return. This process, called depth sounding, helps calculate the depth. For a pulse traveling straight down, scientists multiply that time by sound speed, then divide by two.
The division matters because the sound made a return journey. Without it, your underwater mountain would acquire rather unrealistic dimensions.
Sound travels through seawater at approximately 1,500 meters per second, although water conditions change that speed. Angled beams require additional calculations to turn the measured distance into depth.
Replacing a narrow line with a broad fan
Early surveyors used a lead line: a weighted rope lowered by hand to measure depth. Later, single-beam sonar systems, often called fathometers, measured a narrow path beneath a moving ship.
Multibeam sonar systems, developed in the 1960s, transmit a fan-shaped spread of acoustic beams from the ship’s hull. Each returning echo helps measure a wider strip of seabed.
The EM300, for example, operates at 30 kHz and measures depths of about 10 to 5,000 meters. Its expected vertical error is below 1% under suitable conditions. Other sonar systems work at greater depths.
How a moving ship produces a finished map

A ship doesn’t simply sail across the ocean and print out a finished chart. It collects measurements that need corrections, comparisons, and careful placement.
Accounting for the water and the vessel
Temperature, salinity, and pressure affect sound speed. Changing water layers also bend sound, which can shift where an echo appears to originate.
Survey teams measure these conditions through the water column and use them to correct the acoustic paths. Meanwhile, positioning and motion sensors record the ship’s location, heading, rolling, pitching, and vertical movement.
Water levels matter too. Depths must relate to an agreed reference surface, called a datum, rather than whichever wave happened to pass beneath the hull.
Joining measurements without inventing terrain
Ships follow overlapping survey lines, rather like mowing a lawn. The overlap reduces gaps and lets neighboring passes provide a useful comparison.
Software combines corrected echoes into positioned depth measurements. Teams remove false returns, examine suspicious features, then use geographic information systems to organize accepted readings into a grid.
A preliminary map can appear during the survey. A reliable final map takes more processing.
Resolution also matters: each beam covers an area, rather than an infinitely small point. A narrow depression can disappear within a larger measurement footprint, especially in deep water.
How satellites find mountains beneath the ocean

Satellites provide a much broader view, although they aren’t looking through kilometers of seawater. They measure the surface and infer what lies beneath it.
Reading gravity’s clues at the surface
An underwater mountain contains extra mass. Its gravity draws water toward it, creating a small rise in sea surface height.
Satellite altimetry measures these subtle bumps and dips. Scientists separate the persistent gravity-related patterns from changing effects such as waves and currents, then infer underwater terrain.
Satellite measurements reveal broad seafloor topography across enormous areas. However, the inferred shape has less detail than a close, direct sonar survey.
What SWOT adds to the picture
The NASA-CNES Surface Water and Ocean Topography satellite, or SWOT, observes about 90% of the globe every 21 days.
According to NASA JPL’s seafloor mapping account, its measurements can reveal seamounts less than 1 kilometer tall, including features below roughly 500 meters in height.
SWOT also improves our view of abyssal hills. These relatively small underwater hills cover about 70% of the ocean floor and are Earth’s most abundant landform.
Repeated observations improve the gravity picture. They don’t replace the detailed measurements needed to chart a particular underwater hazard.
Where lasers and underwater robots fit
Sound handles much of the deep ocean, but different settings call for different tools.
Airborne topo-bathymetric lidar uses laser pulses to measure land and shallow underwater terrain. Green laser light can penetrate clear water, allowing instruments on aircraft to distinguish reflections from the surface and seabed.
This makes it useful for shallow coastal shelves and intertidal zones. The limits are practical: cloudy water, suspended sediment, waves, and depth can prevent enough light from returning. A green laser doesn’t give an aircraft a clear view of an ocean trench.
Autonomous underwater vehicles, or AUVs, approach the problem by carrying sonar closer to the bottom. Shorter distances allow finer measurements of selected areas.
The tradeoff is coverage. A ship can survey broad swaths, satellites cover huge regions indirectly, and an AUV can examine a smaller area in greater detail. Launching, operating, and recovering the vehicle also adds time and expense.
Why most seabed still lacks detailed surveys
Global bathymetric maps already exist; what remains incomplete is direct measurement at useful levels of detail.
Understanding the different coverage figures
NOAA reported about 23% coverage in 2022, with the more precise figure at 23.4%. NASA JPL’s SWOT account describes roughly 25% as surveyed using ship-based sonar.
A later NOAA summary of GEBCO_2025 puts mapped coverage at 27.3%.
These figures belong to different reporting snapshots. They also need their measurement standards attached: a satellite-derived estimate and a modern multibeam survey don’t provide equivalent evidence.
Even “high resolution” is relative. A grid suitable for understanding a deep-ocean basin may still be too coarse for identifying a small navigation hazard.
Why the 2030 goal is demanding
The Nippon Foundation-GEBCO Seabed 2030 project aims to produce a complete high-resolution global seafloor map by 2030.
The project combines new seabed mapping measurements with existing data that wasn’t previously available for the global map. Contributions from research vessels, governments, and industry all matter.
Ships are expensive to operate, remote waters take time to reach, and shallow-water surveys cover narrower strips. NOAA’s often-cited estimate suggests one ship could need nearly 1,000 years to map the entire ocean at all depths.
That estimate depends on survey assumptions. Still, it explains why the project requires shared data and many vessels. The deadline is a target, rather than a guarantee that every location will receive equally detailed measurements.
Why detailed maps matter beyond exploration
Nautical charts use bathymetric data to show depths and hazards, including reefs, underwater mountains, and the steep terrain around trenches. Missing a feature can have serious consequences.
In 2005, the submarine USS San Francisco struck an uncharted seamount. The collision demonstrated how a broad understanding of ocean terrain can leave dangerous gaps.
Bathymetry helps engineers plan submarine cable routes and researchers identify benthic habitats near a mid-ocean ridge, along slopes, and around seamounts.
Closer to shore, depth affects how tsunami waves travel and where their energy concentrates. Our explanation of how tsunami forecasts work explores why neighboring coastlines can experience different effects.
The useful question is therefore more precise than whether an area has a map: does that map contain enough detail for the decision being made?
Where you can explore free ocean floor maps
GEBCO, the General Bathymetric Chart of the Oceans, provides a free global terrain grid. You can explore its ocean-floor information or download data for mapping and analysis.
NOAA’s NCEI Bathymetric Data Viewer offers another route. Its interactive map lets you explore survey coverage and access bathymetric datasets, including multibeam measurements.
When looking at either, distinguish the depth model from the underlying survey coverage. A beautifully shaded seabed can look equally convincing in well-surveyed and poorly surveyed places.
A continuous global map can combine direct measurements with estimated depths. Its smooth appearance doesn’t mean every location received a sonar survey.
Zooming in enlarges the display. It doesn’t automatically add measurements that were never collected.
Key takeaways
Ocean floor mapping combines methods with different strengths. Ship-mounted sonar measures depth directly, satellites infer broad terrain through gravity-related surface changes, and lasers help in shallow, clear water.
The finished map depends on corrections and quality checks as much as instruments. Its usefulness depends on resolution and evidence, rather than how detailed its colors appear.
Frequently asked questions
Can cameras map the deep ocean floor?
Cameras can map small areas when brought close enough to the bottom, usually with artificial lighting. They can’t see the deep seabed from a ship at the surface.
Underwater vehicles can combine photographs with sonar. The images reveal visual details, while acoustic measurements establish terrain across a wider area.
How deep is the deepest mapped location?
Challenger Deep in the Mariana Trench is nearly 11 kilometers below sea level. A pressure-based study estimated the deepest observed seabed at 10,935 meters, with uncertainty of about 6 meters.
Our explanation of measuring the ocean’s deepest point shows why survey methods and measurement uncertainty matter alongside the headline number.
Mapping What We Can’t See
We map the ocean floor by measuring signals that reach us: returning sound, reflected laser light, and surface changes caused by gravity.
The careful part is understanding what each signal can establish. A trustworthy map makes the hidden terrain clearer while preserving the difference between what was measured and what was inferred.


